Au.Tra.Sy. blog:
Excellent! I would recommend following volatility research too (link provided in post).
Trade with the “Big” Trend
Bespoke:
S&P 500 Breadth Hits a High For the Year
Breadth Pulls In Slightly
MarketSci:
An Early Look at Thanksgiving
The Big Picture:
“Quantitative Mining” Debasing Gold
Fascinating!
Kvetching on 311: What New Yorkers Complain About
Percentage of Stocks Over an Index’ Moving Average as an Oscillator
Sunday, November 14, 2010
Top40 - end of the day recap for week ending on November 14th

In this week’s update I will take a look at some important end of the day levels and ways to play them.
Last week was more or less sideways week with candles that showed indecisions. There are many reasons for that as numerous traders did not believe in this break out and were not ready to participate in it. But, as we all know, market does what it wants and it doesn’t care what traders think about the market. I believe that the most of them who missed this move are now expecting pullback, so no money is getting into market.
Top40 chart is showing us that market is trending very nicely from the low which was set in late August. Since then market added almost 5000 points and all of that in almost straight line. Close on Friday at 28253 was the highest close on Top40 from July 1st, 2008. Problem that Top40 is experiencing now is trend line connecting last two tops with current market top. It was tested few times this week and market had difficulties to break above it. Trend line is almost parallel with major trend line that started in early 2009 and all in all we have very nice channel.
Small channel that developed from low in August nicely determines current uptrend, with market spending most of the time next to top line. It is easy to see that 10 and 20 exponential moving averages are working as nice supports with 20 ema being tested only once over last 2 months. Oscillators on the top are overbought, but that by itself does not mean market shall collapse. In strong trends oscillators tend to stay overbought.
So, all in all, Top40 is in nice strong uptrend and so far there are no indications change will come soon.
If you are riding this trend - good for you and enjoy while it lasts. However, if you have missed it, don’t try to short it because there are good chances that you are going to lose money. Rather try to find nice pullback to hop onto it with tight stop loss.
Levels to watch are 20 exponential moving average and bottom of the channel - both in 27500 region currently. If Top40 closes bellow those two, one should consider closing long, or if we come close and test them one should add to long position with tight stop loss again.
My personal opinion is that we are not going to collapse 10-20% from here, more likely we are going to continue going up, with small pullback here.
Trade with trend!
Monday, November 8, 2010
Monday Reading
Afraid to Trade:
Remember Remember the Fibonaccis in November
Au.Tra.Sy. blog:
State of Trend Following: October, best month of the year so far
Bespoke:
Dollar and Stocks Not Getting Along So Well Lately
Silver Gets No Respect
ETF Prophet:
Analogues Suggestive of SPX 1,250 by Year-End
Quantifiable Edges:
The Importance of Breadth & Volume Confirming A Move To New Highs
SMB:
The Fixed vs Growth Mindset- The Consequences (Part III)
The 800 pound gorilla in the room: EXITS
The Big Picture:
Current Dow Rally, Duration and Magnitude
The Talent Code:
How NOT to Develop Your Talent: The 3 Deadly Habits
Trading the Odds:
%B and (really) Overbought?
VIX and More:
Money Market Mutual Funds
Wednesday, November 3, 2010
J154 daily and hourly chart


First chart is end of the day chart from March 2008 and it shows clearly peak from 2008. After massive drop, index bounced and trended nicely. In April 2010 it broke trend line and retraced somewhat, making what can be seen as triple or quadruple bottom around 6800-6900 level. After last bottom was recorded at end of August 2010, market relied strongly and currently is at 8700 or some 2000 points from the bottom, what makes around 30% run. There is massive resistance on the same chart around 9100 that was tested already twice in January and April 2010. There are good chances that we are going back to it to test that level again. What is very symptomatic is that if J154 breaks above there is not much resistance all the way to all time high around 12700.
Second chart just shows how this 30% move from the bottom panned out. There are nice trend lines all the way that were not broken. J154 extended high above trend line, so we could see temporary pullback towards 8500 level. But, before this index clearly shows us some downside, I would not short J200.
Trade with trend!
EDIT:

As from 04.November J154 reached resistance at 9100. As you can see bump it's head three time today agains it.
There are two options now, first one is break above tomorrow where J154 will make new year to date high or second is small pull back and retest again.
Saturday, October 23, 2010
Weekend reading
This weekend’s selection is really good one and I would truly recommend to all readers to devote some time to read and chat with these articles. Enjoy!
Afraid to Trade:
Unusual Similarities in Structure for Current Rally and Prior Creep Up
BIDU Joins the Ranks of the Ten Baggers and a Lesson in Holding On
Au.Tra.Sy. blog:
Trend Following Wizards in September 2010
Word of Caution on Statistics
Bespoke:
Google (GOOG) 10%+ Gaps Higher
David Varadi:
Simplicity at the Expense of Reality
Derek Hernquist:
Think Differently, Not Opposite, About Markets
The Big Picture:
Peak Earnings Versus Stock Peaks
The Kirk Report:
Visualize Success
Simply amazing interview with Mike from SMB!
Mike Bellafiore
Monday, October 18, 2010
Monday reading
Afraid to Trade:
Fascinating Chart as SPX Stays Tight Within Sigma Bands
Bespoke:
S&P 500 and Sector 6-Month Trading Range Charts
77.6% of S&P 500 Stocks Overbought
Relative Strength: Consumer Discretionary and Financials
Sovereign Debt Default Risk
Derek Hernquist:
(Mis)Use of Market Indicators
SMB:
Random thoughts (or, rather, thoughts about randomness)
The Big Picture:
Mortgage Market Breakdown by Equity/Delinquency
Sunday, October 10, 2010
Weekend reading
Afraid To Trade:
Quick Charting the EURUSD Daily Measured Move Price Target
Three Simple Trends You Should Not Be Fighting
Current Hourly Price Structure and Insights for the Dollar Index
Au.Tra.Sy blog:
September State of Trend Following report
Bespoke:
A Tale of Two Chinas
Percentage of Stocks Above 50-Day Moving Averages
Kiss the Financial Crisis Goodbye!
S&P 500 Priced in Gold
Over 69% of S&P 500 Stocks Are Overbought
MarketSci:
Very important!
More Random Bits of Data: Asset Class Correlation
Quantifiable Edges:
Happy Columbus Day?
The Big Picture:
Very interesting!
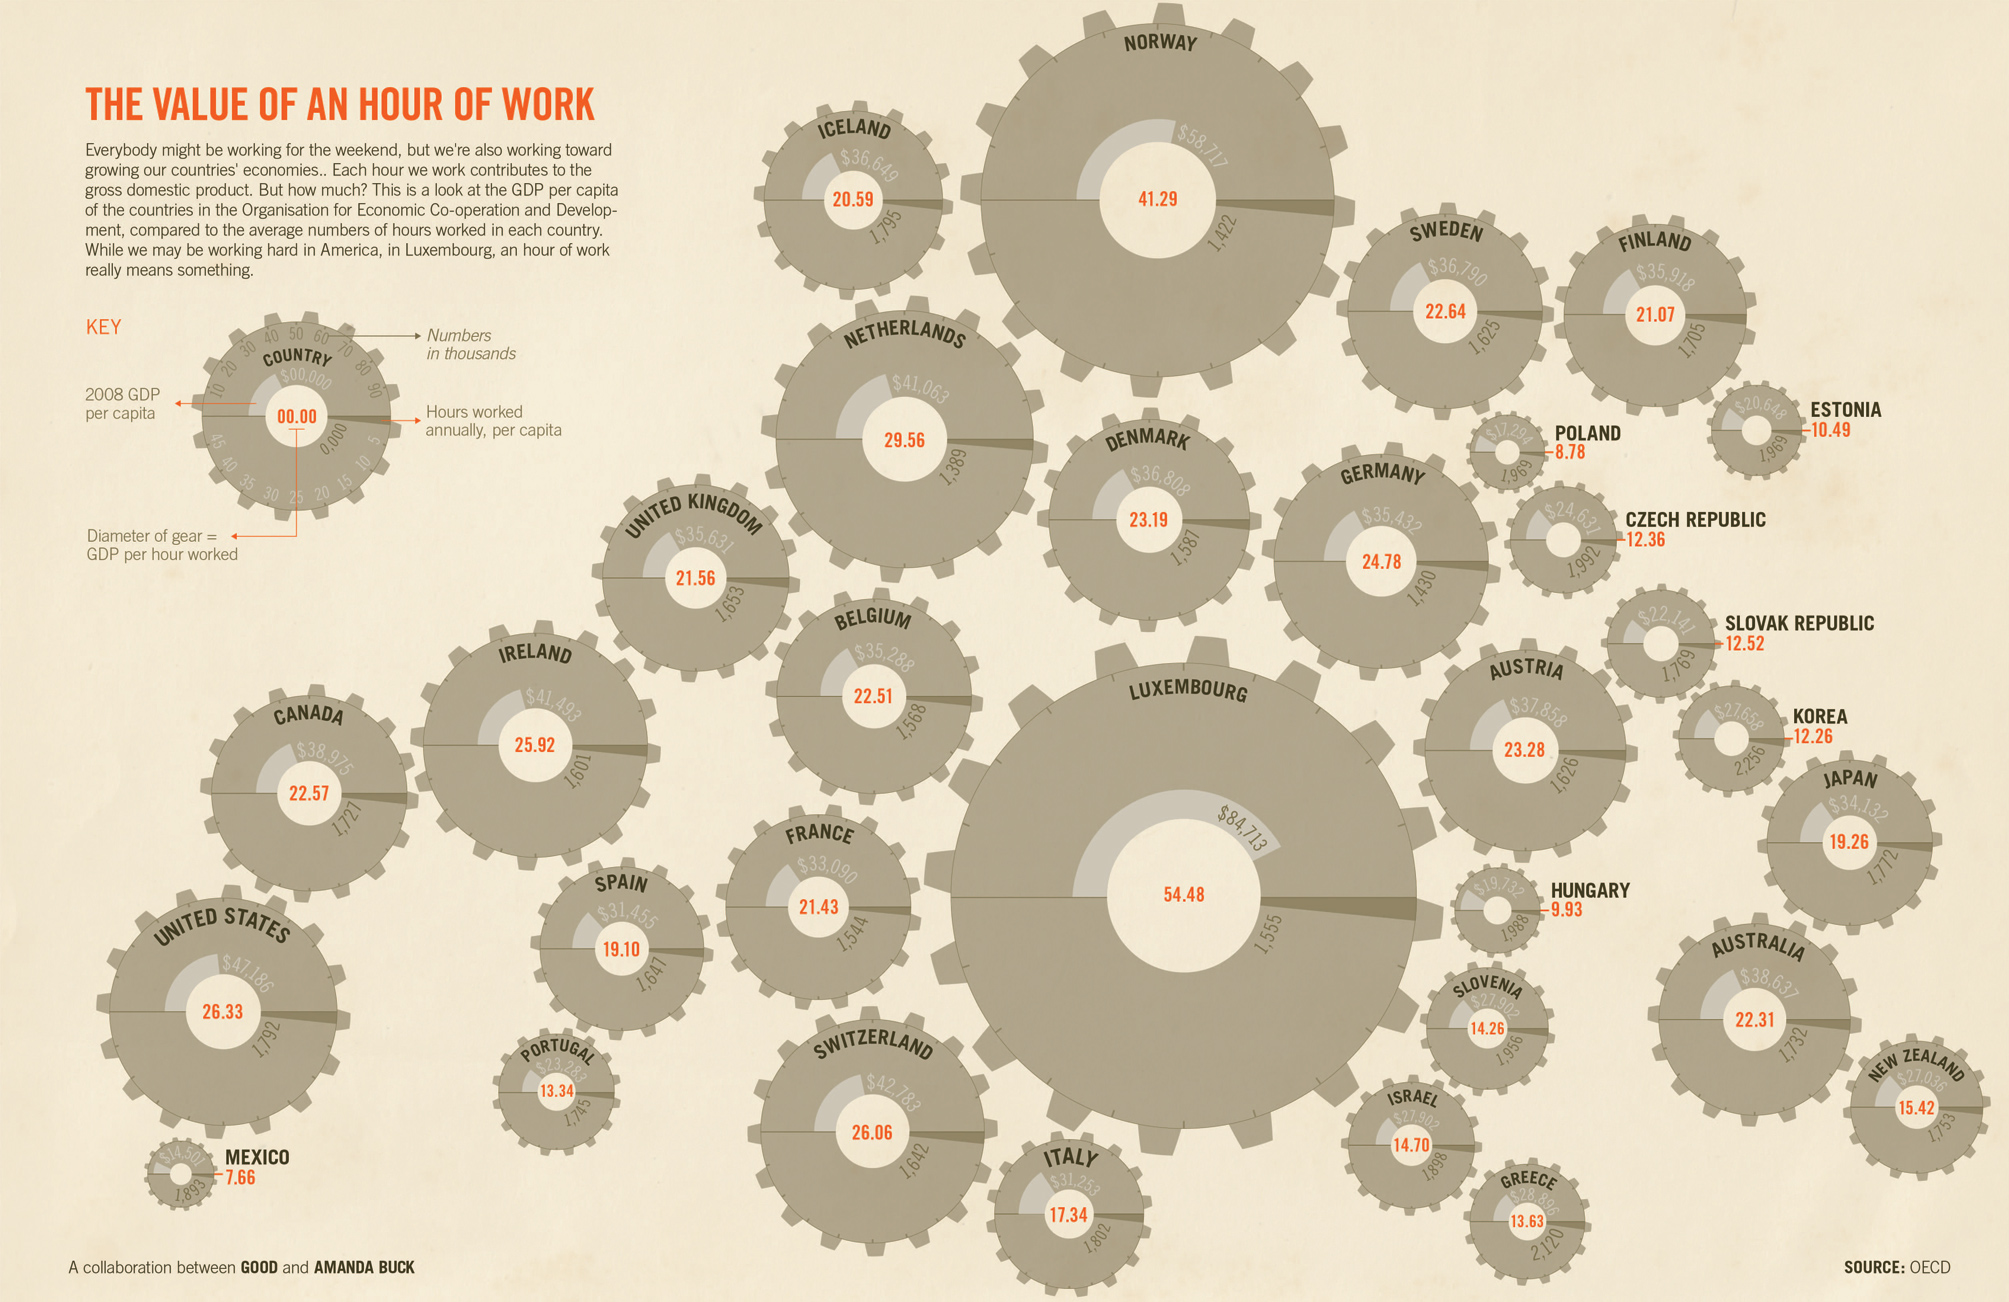
The Value of an Hour of Work
Excellent!
Gold Hits Our $1350 Target; Now What?
Explosive Growth in Food Stamp Usage
NFP Chartfest
The Kirk Report:
Lessons & Rules
Quick Charting the EURUSD Daily Measured Move Price Target
Three Simple Trends You Should Not Be Fighting
Current Hourly Price Structure and Insights for the Dollar Index
Au.Tra.Sy blog:
September State of Trend Following report
Bespoke:
A Tale of Two Chinas
Percentage of Stocks Above 50-Day Moving Averages
Kiss the Financial Crisis Goodbye!
S&P 500 Priced in Gold
Over 69% of S&P 500 Stocks Are Overbought
MarketSci:
Very important!
More Random Bits of Data: Asset Class Correlation
Quantifiable Edges:
Happy Columbus Day?
The Big Picture:
Very interesting!
The Value of an Hour of Work
Excellent!
Gold Hits Our $1350 Target; Now What?
Explosive Growth in Food Stamp Usage
NFP Chartfest
The Kirk Report:
Lessons & Rules
Thursday, September 30, 2010
Thursday reading
Thursday reading
Afraid to Trade:
Update on SP500 Intraday Triangle and Market Internals
Bespoke:
# of IPOs by Month
Volatility Check-Up
29 Stocks in the Nasdaq 100 Up More Than Gold
CXO:
How Much Can High-frequency Traders Really Make?
Dollar-Euro Exchange Rate and U.S. Stocks
The Big Picture:
War & Peace + Inflation + Secular Bull = Dow 38K ?
Global Public Debt Clock
Trading the Odds:
Permanent Open Market Operations (POMO)
Monday, September 27, 2010
Top40 - end of the day recap for week ending on September 26th

There is funny coincidence that out of last nine trading days only two were with some direction –both bullish and both were Mondays. Knowing that Friday was public holiday in South Africa and that US and European markets performed nice rally on Friday, there are good chances that we will have third Monday in a row with nice direction. Will the rest of the week be the same like the case of last two weeks, it is to be seen, but I hope that it is not going to be the case.
If we examine chart we can see horizontal resistance at 25800 and Top40 (J200) spent last week just bellow it. If J200 follows international markets then on Monday it should break that resistance with next possible stop around 26550 level, which is year to date high.
What we can also see on this chart is that 10 exponential moving average (green line) was acting as perfect support. From August 31st, when it was broken for first time, it was tested five times. So, if I was to short this market based on end of the day chart, I would consider waiting for 10 exponential moving average to get broken and it would be ideal for J200 to close below it. (Moving averages are, for me, the most important indicators and very often market stops exactly on them. I would highly recommend to traders with no experience to go and study moving averages, because one can trade with moving averages only and be very profitable.)
Indicators on top did not change much when compared to where they were last week. So, MACD is above signal line and above 0, RSI is still around 65 and it is not moving much, but that is expected when it deals with market with no much momentum. Stochastic is well above 80 and it is bouncing around 90 and it is not moving much, but, again, that is expected when we deal with nice trending move.
Last directional move on J200 from August 25th to September 23rd recorded 2111 points or just above 9%.
Trade with trend!
Saturday, September 25, 2010
Weekend reading
Afraid to Trade:
The All Important Level to Watch on the US Dollar Index
SP500 Levels to Watch and Market Realities You Should Know
Bespoke:
No Longer A "Goldman" Market
International Revenue Exposure
Technology Rallies; Financials Falter
Charts Gone Wild:
Excellent post with some sharp old-school and new-school points!
Key Psychological Shifts Forming the Foundation for this Rally
CXO:
Turn-of-the-Month Effect Persistence and Robustness
Does the Turn-of-the-Month Effect Work for Sectors?
The Big Picture:
Job Change Post-Recessions
Property Taxes in America
US National Net Worth Plummeted 26%
Effect of Structural Deficits on USA National Debt
4 Recessions (and Recoveries)
Thursday, September 23, 2010
USDZAR end of the day chart

During last few days Rand was appreciating against US dollar or, should we say, US dollar was losing value against all major currencies and commodities, so Rand was gaining against it too.
We should take a look at what end of the day chart is telling us:
Firstly, USDZAR is in clear downtrend from peak that was made in July 2008 (when risk appetite for emerging markets dried out). From almost 12.00 we came all the way down to 7.00, where it is trading now.
On downside (ZAR appreciation) we can look at 7.00 level that was breached yesterday for short period of time, but pair bounced back above. Below we have 6.80 that played massive role in the past. From 2005 all the way to 2007 – 6.80 was resistance, then support, then resistance again and then support again, and it looks this time around it will act as support again. If that level is broken we can see more downside for USDZAR with potential target in 5.70-5.90 region.
On the upside first resistance to watch is 7.20 that acted as support for more than a year (from August 2009 till few days ago). Above that we have downtrend line that currently seats around 7.35 and if that level is broken, than we again have horizontal resistance around 7.80-8.00.
For now I guess USDZAR will test 6.80, but from there on, I believe one should be very careful. Fast bounce towards 7.20 is most probable scenario after test.
Looks like RISK is ON for now and money is flowing into South Africa.
Trade with trend!
Wednesday, September 22, 2010
Trading course
Over the last few weeks I’ve received quite a few e-mails with questions regarding trading courses in South Africa - which one should attend and what course is the best one?
I’ve tried to answer everyone’s questions, but then I’ve realized that I can type post that is going to address that subject.
I would like to start by sharing my experience from years back, when I started with trading. At that stage there were no blogs, tweets and other modern ways of sharing information about trading - one could buy a book or attend a course. So, I started to read and buy books and as I was reading them I would go over some of them a few times. At the same time, my first course that I attended was SA Warrants and that’s when Simon and Manfred explained warrants and how they work and who makes the market. They also used all funny Greek letters. Some time later, my second course was about Technical Analysis and it was presented by the same guys. Also, some time later Larry Williams came to SA and I was attending his course as well, and I must say that I can not recall ever having spent money on as bad a thing in my life. Finally, at that stage trading blogosphere was emerging and I would read all that I found interesting.
After several years I’ve decided to go for another course, named “ALSI trading” presented by Dr. David Paul and followed the following year with another of his courses which was a two day course. Those two were good ones and really enjoyable.
So, let’s go back to the topic – Which course is the best in South Africa and which courses should one attend?
I guess my answer is going to steer a lot of unhappiness among course organisers, as my answer is: simply NONE!
Reasoning behind this opinion:
Course that you choose to attend is, probably, going to be overpriced. You will have to pay approximately R10.000 for some lousy lunch, where somebody with very little or no experience in trading will teach you two or three shady setups that you will most probably forget before you get home or maybe even earlier. They will, for sure, try to sell you the next course that will teach you all that you need to know to become ultra rich before you are 25 years old and/or they will probably try to sell you software that have all indicators which are optimised for making exactly a million a month.
So, how should one learn about trading?
There is lots of free and quality info available on various blogs related to trading – go and read them! Find ones that you enjoy the most, read them every day or week, read comments published on them, read all that you like and all that you don’t like. Then practice, practice some more and practice every day and every weekend and print daily your charts of instruments you trade, with marked entries and exits and when market is closed dedicate some time and energy to review them. I do that on early mornings of every Saturday and I would suggest you to take approach of printing your charts as you make trades, write your comments regarding entry, target, thinking behind trade, etc. Then, again when market is closed, review and find out if you have done correct thing. And do this over and over again as trading is about practice, like anything else in life. Simply, it is not about perfect indicator or set-up. The more you trade, the more experience you will gather and it is going to become easier for you to see proper set-ups. But, to reach that level you will need to analyze thousands and thousands of charts.
Finally, with all the blogs, books and trading forums - One has no need to go to trading courses, as one can teach oneself all that is needed for trading.
However, if you want to attend a course here in SA, I recommend only courses held by Dr. David Paul.
Trade with trend!
Disclaimer: I am not compensated in any manner by Dr. David Paul and this positive review was not solicited in any way and Dr. Paul was, actually, not aware of this public and positive feedback from me.
Tuesday, September 21, 2010
Tuesday reading
Afraid to Trade:
Unusual Recent Moves with Stocks Oil and VIX
Bespoke:
Dow 30 Trading Range Screen
Charts Gone Wild:
Intermediate-term Index Support/Resistance
CXO:
DJIA-Gold Ratio as a Stock Market Indicator
David Fry:
Bulls Giddy Up
Derek Hernquist:
Imagine Crossing the Behavior Gap
Scott Bleier:
Think all the major indices have broken out? Think again…From CreateCoin Premium…
Quantifiable Edges:
When the SPX and VIX Both Rise on a Friday
SMB:
Traders Ask- What is My One Good Budget?
Pullbacks: an example in RIMM, post-earnings 9/17/10
The Big Picture:
Who Gets What If Tax Cuts Are Extended
Its Official: Recession Ended June 2009
Trading The Odds:
September Seasonalities and OE’s Price Pattern
SPY 2 up before FOMC session
Sunday, September 19, 2010
Top40 - end of the day recap for week ending on September 19th

Last few weeks didn’t bring us a lot on the end of the day front. For almost a year now Top40 (J200) is stuck in sideways channel. In October 2009 Top40 broke 22900 and in that stage such break looked like important one. However, J200 rallied quickly to 25500 in early January 2010 and following January market tried four times to break 22900 and four times to break 25500, with one failed break in April this year.
Currently we are trying for the fourth time. Market spent last few days around or just below 25500, with Friday morning which looked like breakout, but market faded away during the day.
There are massive resistance levels around 25500-26000:
First is 61.8% Fibonacci level for the drop from May to November 2008. Many technical guys consider 61.8% level as last resort for bulls or bears and break of that will be final confirmation that trend has changed.
Second resistance is down-sloping trend line that started on all time high in May 2008. It was tested three times already and it still holds tight. So, break of trend line will be another nail in the coffin for the bears.
Third resistance is horizontal line around 26000 that connects last three tops, including the one that was just a bit higher, but to prevent TA purists even Elder says that you should place lines through congestion, not through exact peaks.
J200 is above all moving averages and they paint bullish picture as well. Indicators are in the upper half, with Stochastic being above 80 for few days already. RSI still have space on top to run, but as RSI is momentum indicator it will move when market moves. Last four days J200 hardly moved on end of the day basis, so RSI is stuck around 60. MACD is pointing up and it is above signal line.
Finally, I am here not to predict what market is going to do, my goal is to follow it. If we check previous events and if market repeats what it has done already few times, I would recommend going short here with tight stop loss (break of 26000). There are not too many reasons to be too bullish here, as there were not too many reasons to be too bearish around 29900. And as law of inertia states: ”A body (market) moving on a level surface will continue in the same direction at a constant speed unless disturbed.” So, as far as I’m concerned market will stay in sideways channel between 22900-26000 levels for now. Break will happen, but nobody can tell you when and whether it will be up or down.
For people that are not used to shorting market, I would use famous words from Jesse Livermore: “After spending many years in Wall Street and after making and losing millions of dollars I want to tell you this: It never was my thinking that made the big money for me. It always was my sitting.”
So, stop thinking, sit, relax and wait for the break. There will be enough points to be made after the breakout, so direction of the break should not be guessed, but waited to be seen.
Trade with trend!
Wednesday, August 25, 2010
ALSI daily range


Just as a follow-up to one of the previous posts (http://alsi-trader.blogspot.com/2010/01/blog-post.html) I’ve decided to post these two charts.
We had some movement and systems responded to a certain degree, but things are not yet as “busy” as we would like them to be.
Trade with trend.
Update on J200 end of the day

I wanted to update Top40 (J200) end of the day chart, as of yesterday’s close.
Top40 (J200) dropped heavily yesterday and just touched trend line. This is third touch and trend line is becoming more valid. Previous low at 23770 is not broken yet, so be careful today out there. Bias is on a short side, but we have lots of support around these levels.
On the bearish side - there is broken rising wedge with target around 22900 and that is still on cards.
Trade with trend.
Mid week reading
Afraid to Trade:
A Closer Look at Corrective and Impulsive Phases in Gold
Twists Turns and Traps: Chart Updates for Potash POT
Bespoke:
Final Earnings Season Stats
Q2 Earnings Growth Beats Expectations
Existing Home Sales Expected to Be Down in the Dumps
Asia's Daily Impact on US Markets
Charts Gone Wild:
Some excellent reading.
The Four Stages of Learning
Correction in the Poker Industry
The Top 10 Largest Crashes
Mutual Fund Industry Unable to Recover, Historically Low Cash Levels
David Fry:
Stocks in Summertime Funk
Scott Bleier:
Everyone is scared shitless. So why isn’t the VIX?
The Big Picture:
Is the Fed Pushing on a String?
Monday, August 23, 2010
Top40 - end of the day recap for week ending on August 22nd

Top40 was in a solid downtrend over last month or so, actually - out of last 18 days only 4 had higher close, while on 14 occasions we had solid red days. Top40 dropped from 25799 on August 2nd to current 23921 (with low of 23770), making it massive 2000 points drop from high to low.
So, let’s first see what patterns and trend lines are telling us: There is massive trend line resistance around 25700 that stopped Top40 twice already this year. That line is drawn from all time high in 2007. Break of that trend line would be very important for bulls, but that is for now out of question. Top40 first has to clear about 2000 points on upside.
On a down side we have trend line support around 23600-23700, just bellow Friday’s levels, and below that value we have crucial support in 23000 range. That support held three times in May, June and early July, as well as it held earlier in February. That same level is neckline for massive head and shoulders pattern that developed over last nine to ten months. Break and conformation below neckline could easily push Top40 down to 19500-20000 zone. So, this is point to watch if you are bear. It looks like range between bulls and bears is getting smaller (it is only 2000 points now), so maybe we could expect some resolution soon.
Indicators look oversold, Stochastic especially, while RSI is not so oversold (around 35 but in current sideways market it dropped below 30 only once). MACD is below 0 line.
Moving averages, which help us to determine long, medium and short-term trends:
• long-term (200sma) - DOWN
• intermediate (89sma) - DOWN
• short-term (10ema) - DOWN
Trade with trend!
Friday, August 20, 2010
EURUSD head and shoulders

Let’s take a quick look at EURUSD 4 hour chart.
Pair broke second important trend line, following break of one in early August. There is more than obvious head and shoulders pattern with neckline around 1.27 being broken. Target for pattern is around 1.21 to 1.22, so we should see more on downside.
EURUSD is in very strong down trend and it looks like it is going to stay like that.
Trade with trend.
Friday, August 6, 2010
End of the week reading
I believe in reading. It is a form of communication, which brings fresh ideas and new perspectives or involves reader in self-discussion which, in turn, leads to more work on current projects. That’s why I share (almost on weekly basis) links to the people who, in my opinion, contribute in positive manner to trading blogosphere.
Here is this week’s selection of people and ideas:
Afraid to Trade:
Au.Tra.Sy. blog:
Bespoke:
CXO:
MarketSci:
The Big Picture:
The Kirk Report:
The Talent Code:
Friday, July 23, 2010
Friday reading
Afraid to Trade:
Color Chart and Major Support Line to Watch in Gold
Will it Hold or Break? Major Resistance Revealed on the Three Indexes
Au.Tra.Sy blog:
Trend Following Wizards – June 2010
Bespoke:
The US Lags
International Market Snapshot
CXO:
Success Factors for High-frequency Pairs Trading
David Fry:
Earnings and Punchbowl Beat Poor Data
Quantifiable Edges:
Low Volume Bounces Like Monday’s Have Fared Poorly in Recent Times
SMB:
Don’t Give Away An Edge
The Big Picture:
Ego: Illusionist, Trader’s Nemesis
The Talent Code:
Why Being Terrible is Kind of Wonderful
Wednesday, July 14, 2010
Mid-week reading
Afraid to Trade:
SPX Tests Critical Daily Resistance Cluster July 13
The Support Shelf and Trading Range to Watch in AAPL
Bespoke:
Down 5 Days, Up 5 Days
Country Stock Market Performance
S&P 500 6-Day Winning Streaks
Woodshedder:
Buy the SPY After 5 Consecutive Higher Closes?
The Big Picture:
The Startup Business Cycle
4 Secular Bear Markets
The Kirk Report:
Everything Evens Out
VIX and More:
The Risk Trade
Monday, July 12, 2010
Reading to kick star new week
Afraid to Trade:
Upside Levels to Watch on the Daily SP500 July 8
Market Internals Matter! A Closer Look at the Three June Market Reversals
Bespoke:
Earnings Season Starts Monday
David Fry:
Light Volume Temptations
Derek Hernquist:
When Should I Break the Rules?
MarketSci:
The Death Cross
Reading the Markets:
Who is a trading talent?
The Kirk Report:
Independent Trading: Pros & Cons
The Talent Code:
The 0.25 Second That Makes All the Difference
Monday, July 5, 2010
Top40 update

Last week was one to forget – in case you are holding Top40/Satrix 40. All in all, over last 9 days Top40 closed only on two occasions higher than previous day and both of those bars were not convincing at all. Market is still holding long term support around 22900, but will see what happens during new week.
Oscillators dropped last week and now they are in oversold position: Stochastic is around 10, while Relative Strength Index is around 40. At the same time, MACD is struggling to break 0 and good thing about MACD is triple positive divergence, which is quite visible now. Positive divergences can be spotted on RSI as well.
Coming week can bring us, as always, two scenarios: First one is bounce from support at 22900 and test of upper trend line and 200 simple moving average which is around 24500. On the bearish side, break of 22900 could take us quickly to 21700 support from August and September 2009.
Moving averages, which help us to determine long, medium and short-term trends:
- long-term (200sma) - DOWN
- intermediate (89sma) - DOWN
- short-term (10ema) - DOWN
Friday, July 2, 2010
Weekend reading
Afraid to Trade:
1930 Dow Comparison Hitting Too Close to Home
Writing the Obituary for the Stock Market
The Collapse of the EURCHF and the Relation to the SP500
Gold’s Strange Top Heavy Chart with Negative Divergences
Hidden SP500 Fibonacci Confluence Last Hope for Bulls
Bespoke:
Reaching the Halfway Mark
Percentage of Stocks Above 50-Day Moving Averages Back Below 10%
Bearish Sentiment at Highest Levels Since July 2009
Percentage of S&P 500 Stocks Above 50-Days Down to 4%
Google (GOOG) In Uncharted Territory
CXO:
Stock Market and the National Election Cycle
A Slinky (Short-term Reversion) Effect?
David Fry:
Incredible Stock Market Performance
Woodshedder:
What you NEED to Know about The Death Cross
Scott Bleier:
A disconnect between Wall Street & Main Street?
MarketSci:
Independence Day and the Stock Market
Reading the Markets:
The growth curve of highly successful businesses
The Big Picture:
Dark Cross History
UK Public Spending by Government Department
Psychology Cheat Sheet
Vix and More:
VIX Showing Signs of Progressive Desensitization
Monday, June 28, 2010
Top40 - end of the week update

It looks like volatility in our market dried up with the start of World Cup. ATR is back below 2% (10-day ATR) and it is pointing down very much. Will see what is going to happen in remaining two weeks.
Top40 tested high around 25300 on Monday, but it did not break it. Trend line connecting two highs (from April) was around same level. After failure to break above, Top40 got sold off for the remaining of the week, recording four red days in a row and closing week at 24263, which is below 200 simple moving average.
Stochastic turned down and currently is around 64, relative strength index is pointing down as well, but it is still above trend line that was made with positive divergences. Macd is above zero and signal line, but as well pointing down.
Coming week can bring us two scenarios: First one is another attack on trend line with high around 25300 and this time 89 simple moving average is there as well. On the bearish side, market can sell off even more and test 22900-23000 level one more time.
Moving averages, which help us to determine long, medium and short-term trends:
- long-term (200sma) - DOWN
- ntermediate (89sma) - DOWN
- short-term (10ema) - DOWN
Monday, June 21, 2010
Reading to kick start new week
Afraid to Trade:
Opportunities and Levels to Watch in NASDAQ and QQQQ June 16
Breakout in GLD? A Look at the Arc and Triangle
Current Standard Deviation Bands for NASDAQ and Dow Jones
Au.Tra.Sy blog:
Trend Following Wizards: negative month (May), 2010 now in the red…
Bespoke:
Stronger Than Expected Capacity Utilization
TED Spread Sees Largest Decline Since March
Gold vs Dollar Correlation
Chris Perruna:
Trend Reversal Coming…?
CSS Analytics:
High Frequency Trading and the Online Retail Investor
CXO:
The Lure of Trading at the Open?
David Fry:
The Most Boring Expiration 'Ever'
Woodshedder:
Backtest Report: Stocks Above 5 Day Moving Avg. Indicator
Scott Bleier:
Dollar Chart-Art…
The Big Picture:
America: Where Are You Moving From?
On the Treasury “Bubble”
U.S. Consumer Spending ChartFest
VIX and More:
The Elusive Trading Range
Top40 - end of the day update

Last week brought us four trading days, with futures close-out on Thursday.
Top40 progressed further and now there are 5 green closes over last 7 trading days. Index added almost 2000 points in those 7 trading days and formed doji on Friday. Target for falling wedge on Thursday has not been met and there are approximately 1000 more points to go.
What should worry bulls is Stochastic, which is resting around 90 level, but as we know it can stay in overbought position in prolonged up moves. RSI is flattening out and MACD is around 0 level, but above signal line.
Moving averages, which help us to determine long, medium and short-term trends:
- long-term (200sma) - UP
- intermediate (89sma) - DOWN
- short-term (10ema) - UP
Tuesday, June 15, 2010
Top 40 - daily update

Today we will take a look at daily chart of Top40 index.
Firstly, what we can see is that Top40 broke down sloping trend line and for now correction is over for this market. Trend line was at the same time top line of falling wedge pattern and with braking of that top line on Thursday and back test on Friday, so far we can say that falling wedge patter is broken. Target for that pattern is around 26100, few points short from year to date high.
If we inspect indicators on top of the chart, there are very obvious triple positive divergences on RSI and Stochastic oscillators and positive divergences on MACD. Stochastic is currently around 70, but RSI and MACD still have room to go up.
So, for now, Top40 chart looks very bullish, but markets are jittery, so have you mouse ready to trade.
On the down side, there is obvious support around 22900-23100. It was tested four times so far in last few months and this level is clear border between bulls and bears. Bulls should not be worried if Top40 is above it.
Moving averages, which help us to determine long, medium and short-term trends:
- long-term (200sma) - UP
- intermediate (89sma) - DOWN
- short-term (10ema) - UP
Subscribe to:
Posts (Atom)